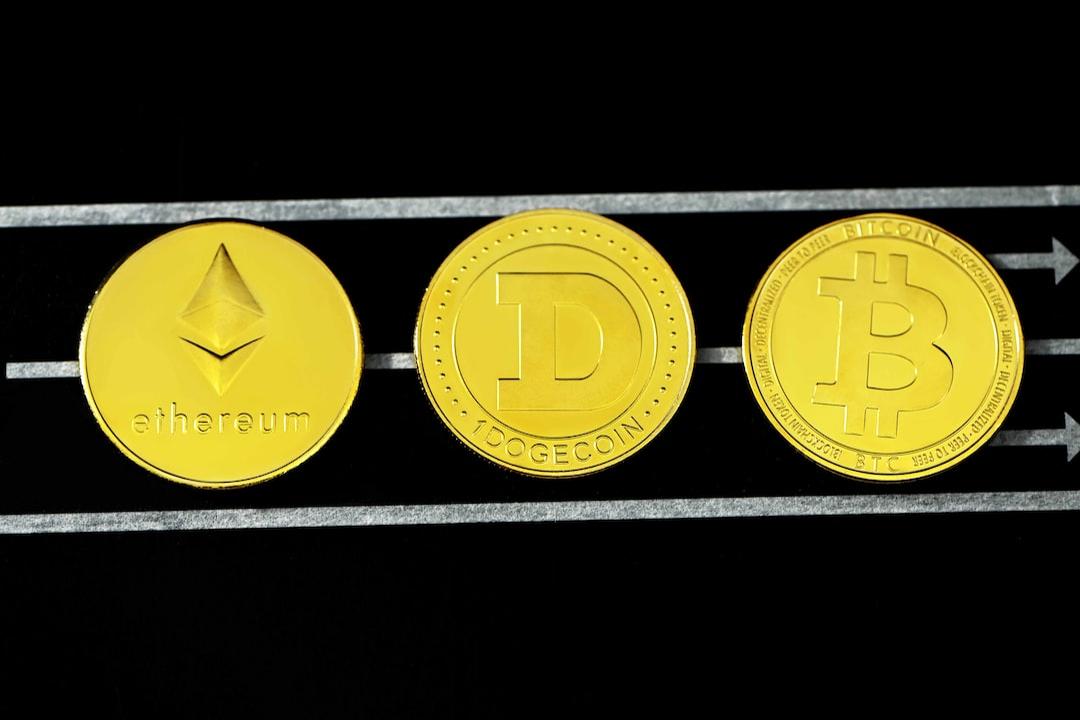
Bitcoin’s price surged following the release of lower-than-expected United States Consumer Price Index (CPI) data. The CPI remained steady compared to the previous month, with a year-on-year figure of 3.3%, showing a slight deceleration from the previous rate of 3.4% – both 0.1% below forecasts.
The strong rebound from the $66,000 mark indicates that bullish investors are still active, purchasing near robust support levels. Traders should anticipate the next significant price movement above $73,777 or below $56,552. Until then, the market may continue to trade within a range.
Japanese company Metaplanet has taken advantage of Bitcoin’s sideways movement to bolster its treasury. On June 11, the firm announced the acquisition of 23.25 Bitcoin, bringing its total holdings to 141.07 Bitcoin, acquired at an average price of $65,365.
Can buyers sustain the recovery in Bitcoin and other alternative coins? Let’s examine the charts of the top 10 cryptocurrencies to evaluate.
Bitcoin’s Price Analysis:
Bitcoin dipped below the 20-day exponential moving average on June 11 but found support at the 50-day simple moving average. Buyers stepped in, pushing the price above the 20-day EMA, suggesting that the BTC/USDT pair may trade within a narrow range between $66,500 and $72,000 for some time. To regain control, buyers need to push the price above the $72,000 to $73,777 resistance zone, opening the door for a rally towards $80,000 and eventually $88,000.
Ether’s Price Analysis:
Ether failed to surpass $3,730, leading to a decline below the 20-day EMA. However, strong buying near the 50-day SMA indicates solid demand at lower levels. Buyers will attempt to break above $3,730, with potential targets at $3,887 and $3,977. Conversely, a rejection at $3,730 could result in a retest of the 50-day SMA, with a further drop towards $2,850.
BNB’s Price Analysis:
BNB dropped below the 50-day SMA on June 11 but buying pressure prevented further declines. Bulls are aiming to surpass the $635 resistance, signaling a potential end to the correction. If successful, the BNB/USDT pair could target $722. However, a failure to break above $635 may indicate continued selling pressure, potentially pushing the pair towards $536.
Solana’s Price Analysis:
Solana broke below the 50-day SMA on June 11 but quickly recovered from the descending channel pattern’s support line. Bulls are expected to push the price above the resistance line, aiming for targets at $176 and $189. Conversely, a sharp downturn from the 20-day EMA or the resistance line could lead to a drop to $116.
In conclusion, the cryptocurrency market remains dynamic, with various coins showing potential for both bullish and bearish scenarios. Traders should exercise caution and conduct thorough research before making any investment decisions.

